Other global warming articles

3 degrees: Chief scientist warns bigger rise in world's temperature will put 400 million at risk
Environment in crisis: 'We are past the point of no return'
World is at its hottest since prehistory
Antarctic Peninsula glaciers surge when ice shelf breaks up

Black soot and snow: A warmer combination

Recent warming of Arctic may affect worldwide climate

South American glaciers melting faster, changing sea level

Thin glaciers get thinner in Antarctica
"Some of Antarctica's glaciers are melting faster than snow can replace them, enough to raise sea levels measurably, scientists have reported..."
25 September 2004
New Zealand Herald

Wetter world predicted to counter greenhouse gases
"Australian scientists have found the Earth may be more resilient to global warming than first thought, and they say a warmer world means a wetter planet..."
12 May 2004
New Zealand Herald

Global warming could soon make Antarctica the only place to live, says chief British scientist
"Antarctica is likely to be the world's only habitable continent by the end of this century if global warming remains unchecked..."
2 May 2004
New Zealand Herald

While north froze NZ might have stayed temperate
"New Zealand scientists have found evidence that the Southern Hemisphere may have escaped the extremes of the last Ice Age which froze much of Europe, Russia and North America..."
26 January 2004
New Zealand Herald

Home > Environmental issues > Article > 


2004 fourth warmest year
in over a century

NASA Release February 8 2005

Last year was the fourth warmest year on average for our planet since the late 1800s, according to NASA scientists.

The 2004 average temperature at Earth's surface around the world was 0.48 degrees Celsius or 0.86 Fahrenheit above the average temperature from 1951 to 1980.

Globally, 1998 has proven to be the warmest year on record, with 2002 and 2003 coming in second and third respectively.  There has been a strong warming trend over the past 30 years, that has been shown to be due primarily to increasing greenhouse gases.

Some of the changes in climate are due to short-term factors like large volcanic eruptions that launched tiny particles of sulfuric acid into the upper atmosphere (stratosphere) in 1963, 1982, and 1991. These natural events can change climate for periods ranging from months to a few years.

Scientists use temperatures taken on land and on surfaces of the oceans.  Weather stations provide land measurements, and satellites provide sea surface measurements.

Other natural events, like El Ninos, when warm water spreads over much of the tropical Pacific Ocean, also have large short-term influences on climate.  The high global temperature in 1998 was associated with one of the strongest El Ninos of recent centuries, and a weak El Nino contributed to the unusually high 2002-2003 temperatures.   Even though big climate events like El Nino affect global temperatures, the increasing role of human-made pollutants plays a big part.

Earth's surface now absorbs more of the Sun's energy than gets reflected back to space. That extra energy, together with the weak El Nino, is expected to make 2005 warmer than the years of 2003 and 2004 and perhaps even warmer than 1998, which was far hotter than any year in the preceding century.

Another interesting note is that global warming is now large enough that it is beginning to affect seasons, and make them warmer than before on a more consistent basis.  Compared to the average temperatures from the 1951 to 1980 period, the largest unusually warm areas over all of 2004 were in Alaska, near the Caspian Sea, and over the Antarctic Peninsula.
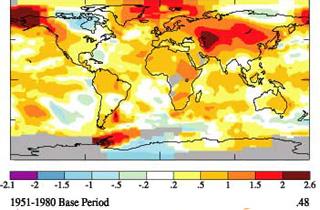
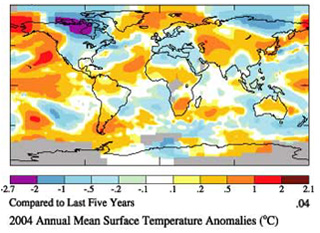


Temperature Comparisons

Top Map: The years of 1951 to 1980 are used as a "baseline" or average for surface temperatures of Earth's land and ocean surfaces.  The top map is color coded to show the differences from the 2004 temperatures to that period.  Yellow to red colorations indicate areas warmer than the 1951-1980 timeframe.

Lower Map above: 1999-2003 temperatures were matched against the global 2004 temperatures, and the result is that the yellow and red areas were warmer in 2004, while the white and blue areas were cooler.  Images NASA


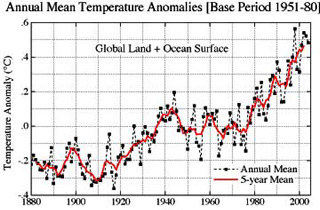
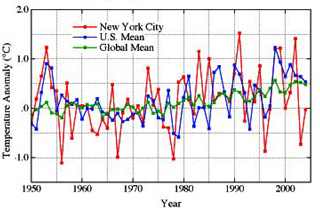
The Warming Trend of Global Surface Temperatures

(Shown above)
Trends of annual surface temperature relative to the 1951-1980 mean: the global mean is shown above top, and the global-plus-local means immediately above.  The upper panel shows that globally the warmest temperature occurred in 1998 (highest black dot on the top right), while the second and third warmest years were 2002 and 2003, respectively.  As the figure shows, there has been a strong warming trend over the past 30 years, a trend shown to be due primarily to increasing greenhouse gases.
Images NASA


Copyright © 2004 TerraNature Trust. All rights reserved.

home | sponsors | latest news & events | join - donate | contact information | projects
volunteer activities | about us | search terranature | environmental issues | New Zealand ecology